My only problem is getting accurate information, which is impossible since everyone has different opinions, even among top players.
just my 6cents though
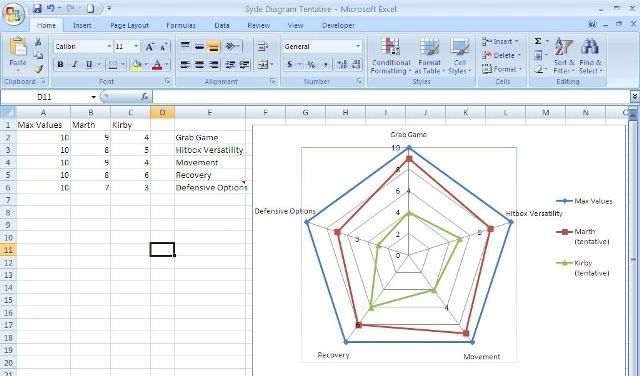
Again, this is not a problem because the means or medians of these tables of data would demonstrate the highest level of the current metagame. Consider that with a group 10 top players the data for Marth's Hitbox Versatility looks like:
Hitbox Versatility: 7, 7, 8, 8, 9, 9, 9, 9, 10, 10
The Standardized Value for that stat would show either
Mean: 8.6
Median: 9
Do that for every number and you get the Standardized Syde Diagram for that character.
With that, you can compare and contrast 1 of the panel members opinions. For example, if Kevin submitted that Marth's Hitbox versatility was a 7 it would show a deviation of 1.6 or 2, depending on whether you were looking at the median or mean charts. From that we can draw 1 of 2 conclusions:
1) The current metagame overestimates how good Marth's hitbox versatility is, according to Kevin.
2) Kevin under values Marth's hitbox versatility in this metagame.
the problem with charts is that there is simply no right answer. everything is an opinion and im just not sure why opinions need to be expressed in charts. sure you could say someone's chart shows that he is better as the sum of 5-10 attributes but characters are not the sum of their parts.
Again, it's not about displaying a right answer because like you're getting at, there is not an actual quantitative value of some of those attributes. Opinions of top level players though are helpful for displaying the current metagame. If we collected data from top players every 6 months or every year then we could have a visual representation of the current metagames take on a match up year to year.
And I think I partly disagree with your last sentence. If you managed to make your categories explicit enough to display all the dynamics of a given character, it would be a very decent representation of what a character is like, especially for the sake of comparing them to other characters. Would those attributes perfectly display a character? Maybe, maybe not, but it can't hurt to find out and it can't hurt to make them available as a learning tool for different levels of players. They would also be super helpful for teaching/displaying perspective and mindsets.
EDIT: Another thing that is cool about this is that these charts would lead to you being able to display match up ratios.
In the Marth Kirby instance I demo'd for the graph, Marth's total attribute points were 41, Kirby's were 22. 41 + 22 = 63
42/63 = ~.0650
21/63 = ~.0349
The match up ratio for my example is that Marth Kirby is 65/35. If this seems erroneous or varies greatly from the accepted standard of a match up, then it's because I was either too generous when assigning values to Marth, not generous enough with Kirby, or that the old ratio is bad.

")