Also, that chart is not the information I was attempting to deliver, Crow.
The most important information were the average character ranking points. We can simply look at the Character Rankings list and count that information without needing a pie chart or graph.
The point is that the "average ranking points" is not useful information on its own, because it is entirely dependent on the cutoff - but I feel like you're not understanding why I'm complaining about that, so let me demonstrate with examples.
Suppose that you, as you seem to think I wanted you to do, set the cutoff at right next to zero. Suddenly, if your character has a bunch of players who got one top8 each,
the character's average plummets! Why on earth should any measure pertaining to a character care how many players there are at the lowest level?
Suppose you put the cutoff so high only one player of each main shown made it in. Now there IS no average to speak of; you're asking "how many points do each of the (Frankly, with only two of each main, as you are using there sill is no
statistically significant average to speak of. N=2 is fail on that regard.)
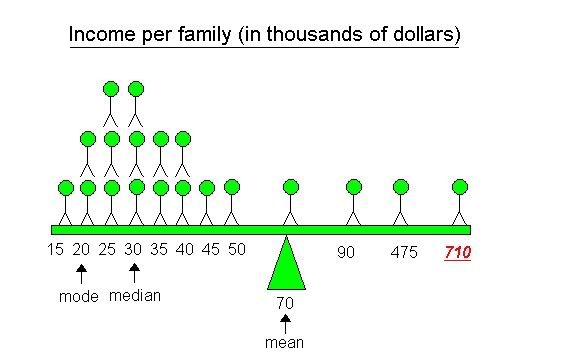
No matter what cutoff you choose, you can't avoid both these problems, because the very averaging you're trying to do is the fundamental cause for the data to be lost. Were the players' scores symmetrically distributed about some mean ranking within each character this would be fine, but the nature of "how good each player is when ranked within each main" necessarily has its mode as far away from the mean as
possible; in other words, the data is very skewed. This is the worst case scenario for applying averages.
Right skewed data necessarily has a mean (average) which is very much too far to the left. Worse, the mean tells you nothing about HOW skewed the data is, and the degree of skewness is what you'd want to look at if you're trying to make any conclusion about the popularity of a character at the highest skill levels.
You're losing information that you otherwise would have because of the averaging.
The chart of unaltered data would actually be useful, plus if the data itself is just shown it's not necessary to talk about things like means and skewness to describe it; people can just look at it and they instantly know as everything there is to tell even if they don't understand statistics.
If you are too scared (or lazy or whatever adjective you'd prefer to use)
to put together and show the original data, let me do it.
Also, no, I have not yet seen a player-centric list from Ankoku yet. I found your post because I was expecting it from what I saw earilier in the day.. so far I've not read up on the entireity of the firestorm that is this thread. I'll keep looking for it though.
Oh, and while reviewing recent posts before finalizing, this struck me as funny given what I'm posting:
Master Raven said:
lol what is this math class?
When there's people around who don't get math, and math provides answers relevant to what those people are talking about, yes, it is
always math class.


")


